07/30/2023: Initial draft.Graylog is an open-source log management and SIEM based on OpenSearch and one that I'm quite fond of due to the well-developed alerting, import, and filtering options that set it apart from other options, like an ELK stack.
This isn't intended to be a completely comprehensive outline of every single way you could log from Lemmy to Graylog, but rather a rough template to get the data ingested into Graylog so you can start tweaking for the metrics and alerts that are important to you once you've got the logs there.
First, I'm going to assume a Docker-based deployment. The following instructions rely on Docker logging, so while the Graylog setup instructions are fairly universal, everything covering ingesting the data relies on Docker functionality.
Setting up Graylog via Docker is pretty easy and they provide comprehensive instructions on a Docker deployment, along with an example docker-compose.yml file. The deployment I've used is essentially their default docker-compose.yml example, with just a single change to accommodate the GeoLite2 City database for GeoIP enrichment.
In the Graylog service block, I added an additional volume directive to allow access to the MaxMind GeoIP database file needed for this to work:
- "/home/lemmy/GeoLite2-City.mmdb:/etc/graylog/server/GeoLite2-City.mmdb"You can obtain this database for free at MaxMind's site, but you'll need to register.
Once you've deployed Graylog and it launches, the next step will be to configure an Input to ingest the logs from the Lemmy Docker containers.
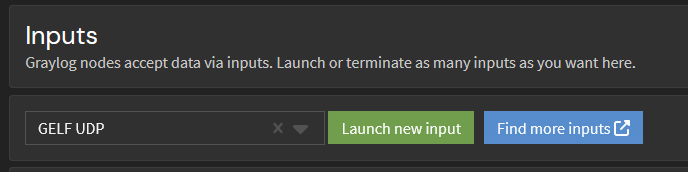
The top menu bar has a System menu, and you want the Inputs option in that menu.
From there, you'll want to select GELF UDP from the dropdown, and then Launch new input.
The only modification I made there was to fill in the required title field. I left the Bind, Port, and other configurations alone. Depending on your network and where the Graylog server is located, the GELF UDP input may not be the right choice for you, but as all of this is running on the same local network for me, it didn't really matter (and UDP is the "fastest" input for Graylog).
If it's successful, you should see a new block under the header of the Local input that shows the new Input.
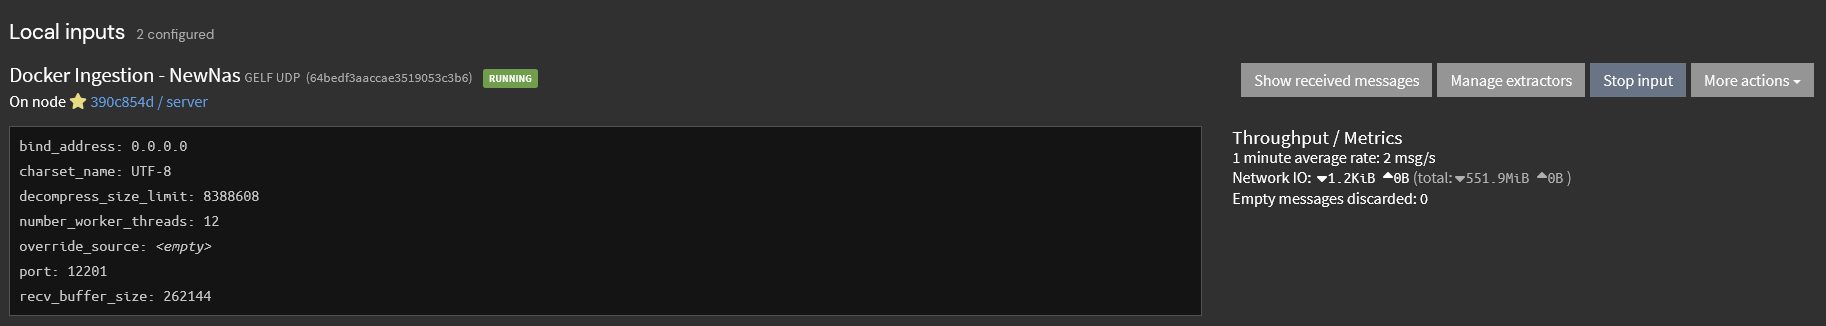
If you do, then congrats: the Input you need for Docker to write to Graylog is created and active, and we're ready to move on to the next steps.
Next up, you're going to want to adjust your nginx logs to output specifically formatted JSON and to write it to stdout. Docker takes the stdout and pushes all of it to Graylog over the GELF driver, so you won't need to log files or run anything that parses and ingests logging like you would with a more traditional ELK stack.
You just need to add a bit of configuration information to the nginx.conf file specifying the log format, and then two directives for the access_log and error_log to write in that format.
My configuration is in the nginx.conf file, and it's part of the http block.
http {

    log_format graylog2_json escape=json '{ "timestamp": "$time_iso8601", '
             '"remote_addr": "$remote_addr", '
             '"body_bytes_sent": $body_bytes_sent, '
             '"request_time": $request_time, '
             '"response_status": $status, '
             '"request": "$request", '
             '"request_method": "$request_method", '
             '"host": "$host",'
             '"upstream_cache_status": "$upstream_cache_status",'
             '"upstream_addr": "$upstream_addr",'
             '"http_x_forwarded_for": "$http_x_forwarded_for",'
             '"http_referrer": "$http_referer", '
             '"http_user_agent": "$http_user_agent", '
             '"http_version": "$server_protocol", '
             '"nginx_access": true }';

access_log /dev/stdout graylog2_json;
error_log stderr warn;
Save and restart, and the Docker container's log output should now be showing you the access and error logs from nginx in properly formatted JSON.
Once you've got the logs exporting as JSON, it's time to update your docker-compose.yml file to include a few pieces of information so that it will log via the Docker GELF driver.
I defined an anchor so that I simplify adding the logging to the containers that I wanted to send the logs to Graylog from, but you can also configure it for all containers the Docker daemon is running if you prefer.
version: "3.4"

x-logging:
  &greylog-logging
  driver: "gelf"
  options:
     gelf-address: "udp://ip-to-graylog:12201"
And, for the nginx configuration, you need to add a logging directive that tells it to use this anchor for its configuration.
services:
  proxy:
    image: nginx:1-alpine
    <truncated configuration data>
    logging: *greylog-logging
Once you've added that configuration to the docker-compose.yml file, you need to update the stack so that it's using the new configuration.
If this is successful, you should be seeing log data in your Graylog instance on the Search menu option. The data isn't properly formatted yet, but check to ensure that you're actively submitting logs and that everything is working before we move to the next step, as you'll need log data to be present in order to configure the data parsing and enrichment.
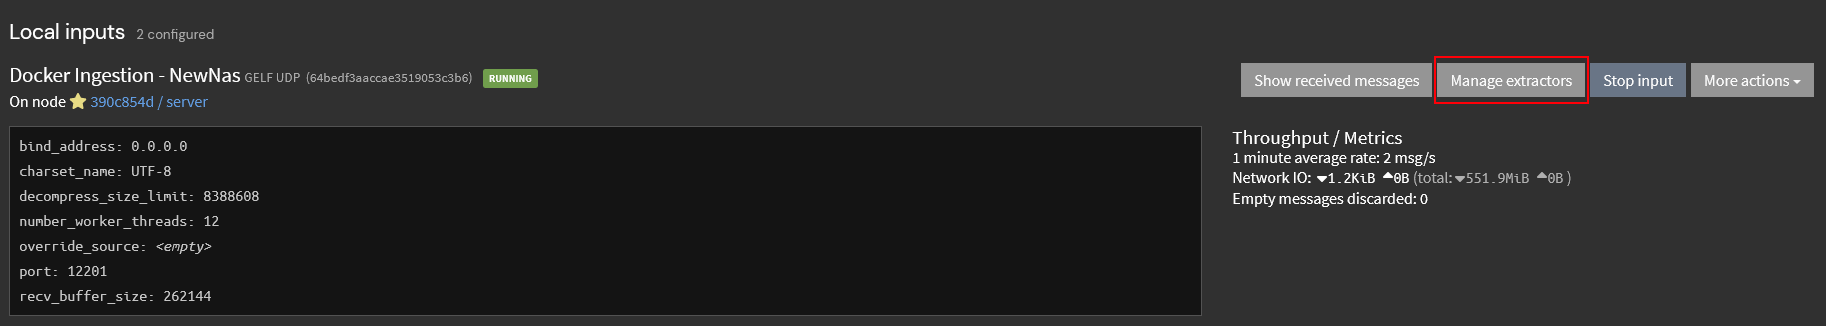
To do this, you'll want to go back to System -> Input and hit the Manage extractors button on the Input you configured previously
You'll want to choose Create Extractor, then pick Load Message. If you're logging more than nginx right now, you may have to find a message ID from the Search option and use Message ID to ensure you're viewing the correct message.
If the correct data has been found, you'll see one loaded below, and a 'message' field that looks similar to the following.

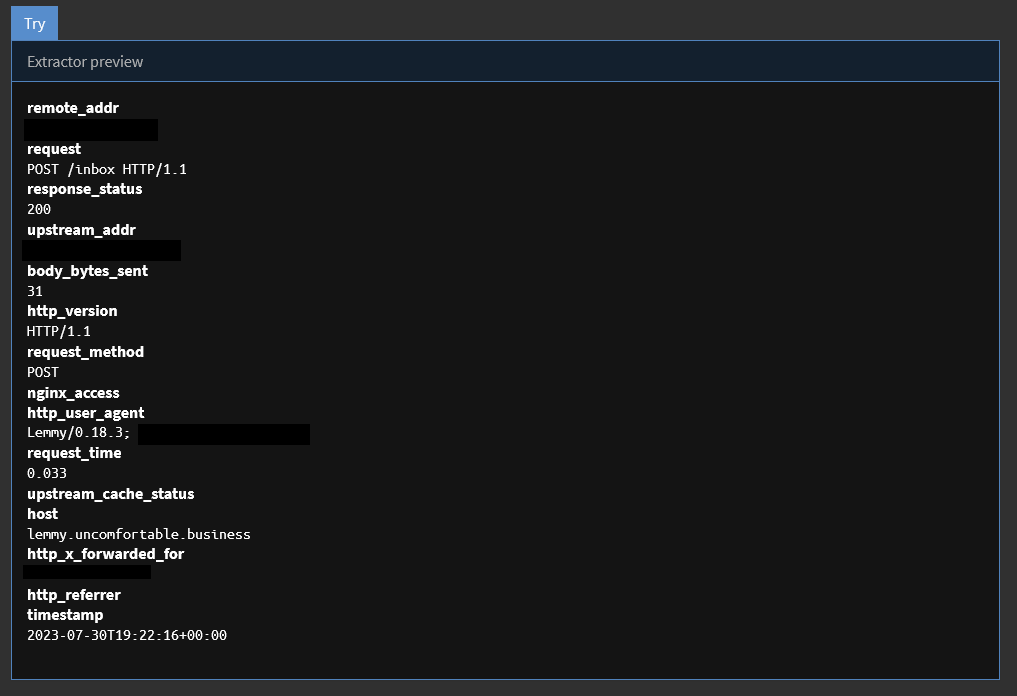
You'll want to choose JSON from the Select extractor type dropdown.
Hit the Try button, and if you've configured the JSON output from nginx correctly, it should automatically populate all the fields properly and won't require any additional tweaking.
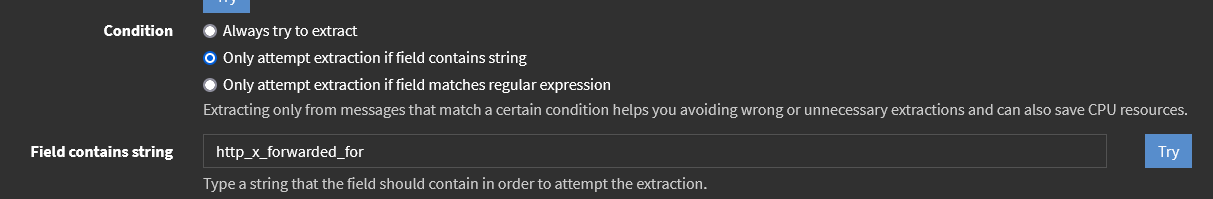
If you're logging more than nginx data, you may want to configure a conditional that only attempts data extraction on messages that are going to contain the data you need. My configuration, for example, will only attempt this extraction on messages that contain http_x_forwarded_for. This is useful for reducing system load by not attempting to parse messages that will always fail.
After you've configured those, and if both Try buttons return successful results, all you'll need to do is to set an Extractor title, then hit Create extractor.
Click the blue Details button, and you should start seeing metrics indicating that incoming log data is being parsed by this extractor.
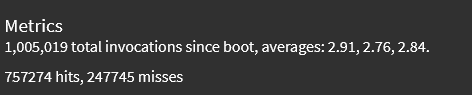
Hits are the indicator that the extractor is parsing log data: if it's going up, then your logs are being parsed properly.
Finally, I'll assume you want GeoIP location enrichment for your data. If you don't you don't need to do this.
There's some pre-configuration required, but Graylog has excellent instructions on how to get the Data adapters, cache, and lookup tables active for the MaxMind data and links to downloading the MaxMind data
These instructions work, with a minor modification of the actual content of the rule you create, because the nginx log configuration uses slightly different variable names. The one below will align with the nginx configuration changes you made earlier, and should work as is.
rule "GeoIP lookup: remote_addr"
when
  has_field("remote_addr")
then
let geo = lookup("geoip", to_string($message.remote_addr));
set_field("remote_addr_geo_location", geo["coordinates"]);
set_field("remote_addr_geo_country", geo["country"].iso_code);
set_field("remote_addr_geo_city", geo["city"].names.en);
end
Follow the instructions from there to complete the pipeline configuration, and you should be able to see the GeoIP information in the 3 new fields.'
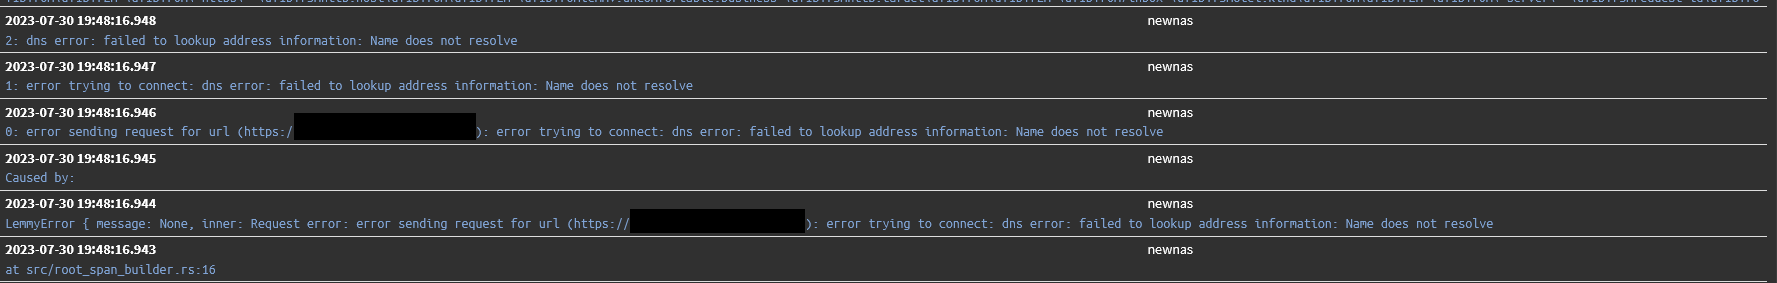
Currently, it doesn't appear that properly formatted JSON logging exists for lemmy or lemmy-ui (but would love a correction if I'm wrong) so while you can write the logs to Graylog, there's a little wonky because they include multi-line stack traces, formatting/color codes and other things that make them a little unwieldy to parse, like so:
Pictrs supports JSON log formatting if you add an environment variable to the docker-compose.yml to enable it (0.4.0 or newer).
- PICTRS__TRACING__LOGGING__FORMAT=json
Configuration of logging for any of the other containers in this docker-compose.yml is simply adding the logging directive pointing to the YAML anchor, similar to what you did with nginx.
logging: *greylog-logging